Organization
From the Organization page, view summary scan results for each organization within your hierarchy. Your organization’s hierarchy includes the root organization, organization levels below the root, and descendant organizations below each level.
To update the hierarchy as your organization changes, such as if you merge with or acquire another organization, submit a change request. For more information, see Submit change requests.
Hierarchy table
The Hierarchy table shows all of the descendant organizations in your hierarchy and details such as the number of services, ports, and vulnerabilities found for each organization. It also shows how many origins we found. An origin is an organization that holds the rights to an IP address in a network and connects it to the internet, such as your organization, a cloud hosting provider, or a third-party vendor. Typically, the origin is the organization associated with the Autonomous System Number (ASN) for the network.
Use the information to verify the structure of your hierarchy and to obtain a high-level snapshot of the health of your networks.
For information about table options, see Tables.
Columns and filters
-
To add or remove information in the table, select Columns and choose the columns to view.
-
To view and manage organizations in your hierarchy that meet specific criteria, such as only those with one or more services running, select Filters and then select how to narrow the data. The filters you select automatically apply to the Hierarchy graph.
infoWhen you filter by a specific organization and a descendant organization doesn't have network resources, we automatically remove the descendant from the table and graph. This automatic filtering causes the Descendant count column in the table to show a higher value than the filter results.
| Name | Description |
|---|---|
| Level | Tier within your organization structure starting with the root at level zero. |
| Organization | Name of the organization or descendant organization within your hierarchy. |
| Service count | Number of service, product, and version combinations on open ports. If there are multiple instances of a combination running on multiple ports, we only count the combination once. For example, if there are two instances of http, Apache httpd, 2.0.0, we only count the combination once. |
| Origin count | Number of organizations that hold the rights to the IP addresses in the organization’s networks and connect them to the internet. |
| Port count | Number of open ports identified for each active IP address, including ports in the system, registered, and private ranges. |
| Vulnerability instance count | Number of vulnerability instances across the organization’s networks. An instance is a vulnerability with a CVE number related to a software service, product, and version combination on an open port. If there are multiple instances of a combination running on multiple ports, we count the vulnerabilities for each port as additional instances. Note that the value in this column might not match any totals in the Vulnerabilities table it links to because of the way the vulnerabilities are dispersed across IP addresses and ports. For details, see Vulnerability instances. |
| Descendant count | Number of organizations that are children, grandchildren, great-grandchildren, etc., of the parent organization. |
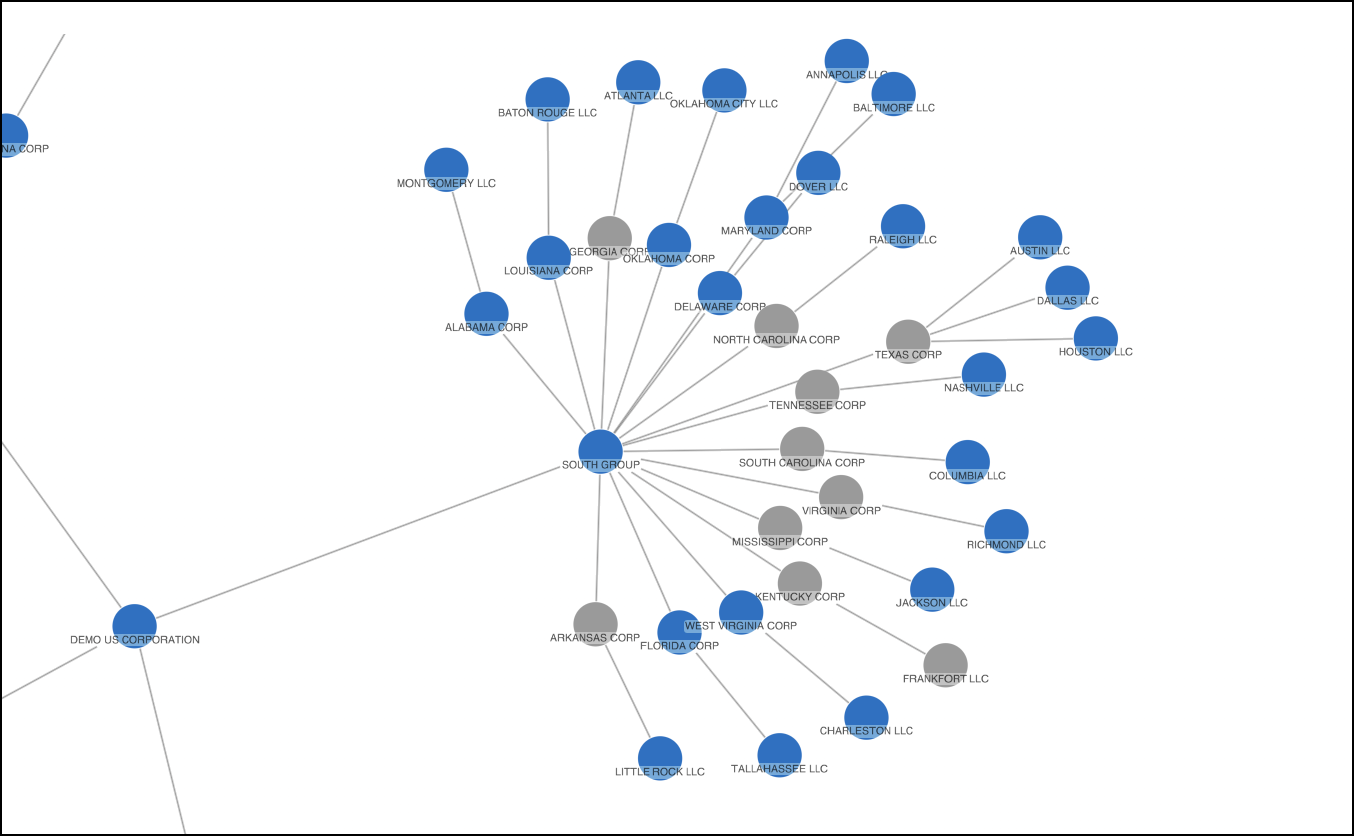
Hierarchy graph
Under Hierarchy graph, view a visual representation of how the organizations in your hierarchy connect.
By default, the graph highlights the names of the organizations with network activity in blue.
Graph options
-
To change the visual representation of your hierarchy, select Layout, and then select a layout option.
-
Organic: Shows your organization hierarchy in a circular arrangement with the root organization in the center and descendants connected by level and distanced apart so that organization groups are clear.
-
Standard: Shows organizations and their levels within your organization hierarchy distributed evenly across the graph.
-
Structural: Shows groups of linked organizations in fans.
-
Radial: Shows organizations in concentric circles around the root organization in a radial tree. Each organization is a new circle that extends outward showing its connection to the root.
-
Lens: Shows, in a circular shape, highly-connected organizations from your hierarchy in the center and less connected organizations towards the edge of the graph.
-
Sequential: Shows the parent-child relationships between the levels of your organization hierarchy.
-
-
To export the graph, select Export and then select a file format from the Type field. Next, select whether to:
-
Export entire chart: Exports a file with all of the organizations in your hierarchy. If you filtered the graph from the table, the file only includes the filtered organizations.
-
Export current view: Exports a file with only the organizations in the current view of the graph.
-
Export all: Exports two files: one with the entire chart and the other with the current view.
When the export is ready, a notification appears in your browser.
-